Server Analytics
ArkenBot tracks activity across your server and displays it in an easy-to-read dashboard with charts and 24-hour stat cards.
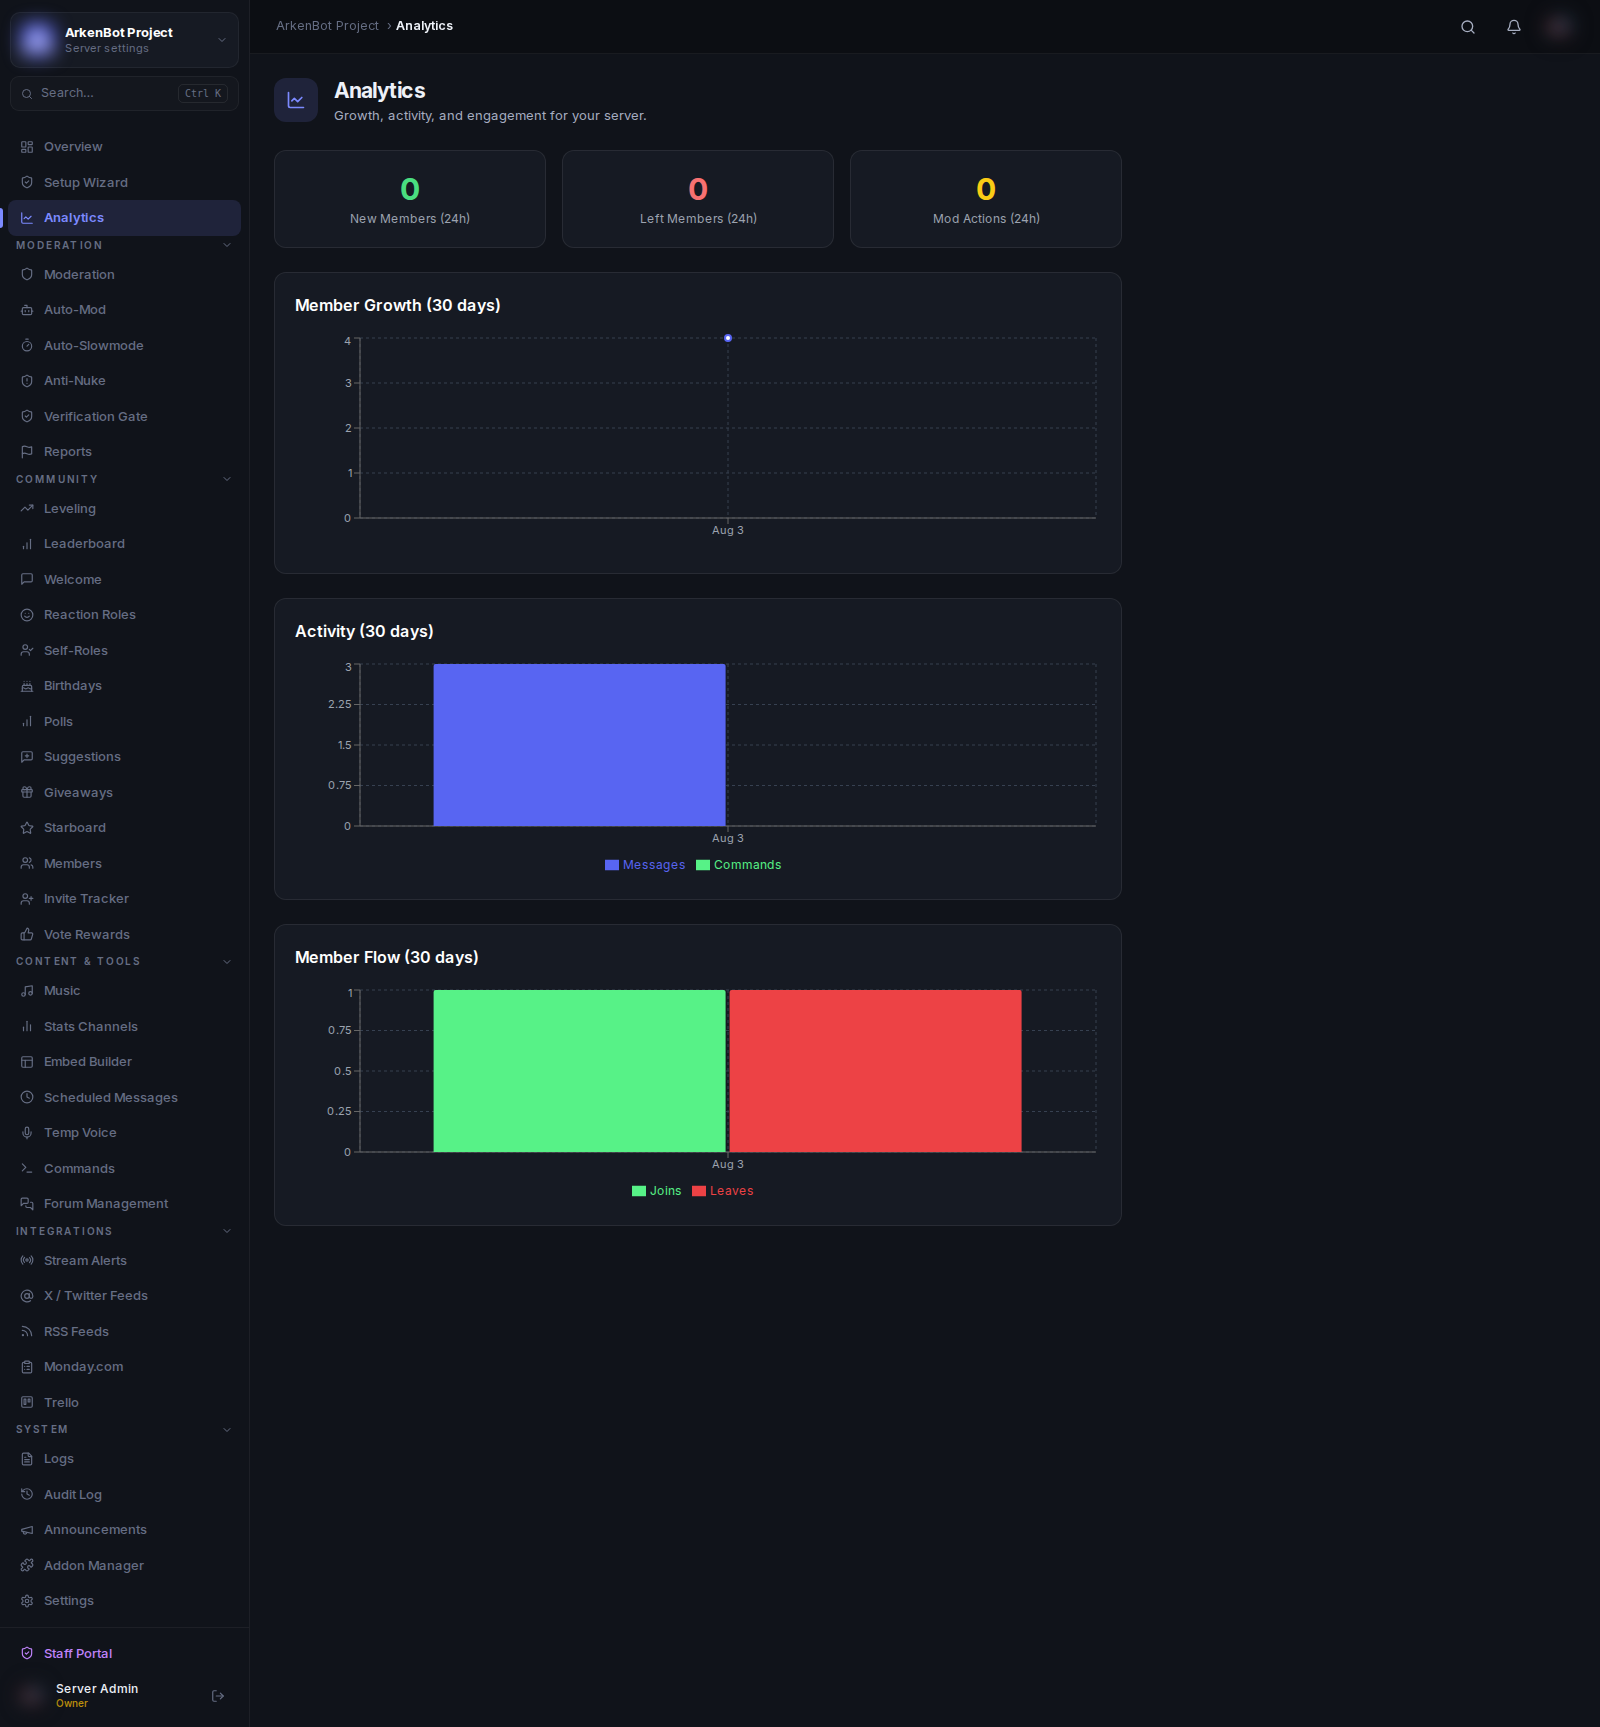
Viewing Analytics
Go to Dashboard → Analytics to see your server's data. No setup is required — analytics are collected automatically once the bot is in your server.
Data is collected daily. Charts will begin populating after the first full day the bot is active.
Stat Cards
Three real-time cards show the last 24 hours:
| Card | What it tracks |
|---|---|
| New Members (24h) | Members who joined in the past 24 hours |
| Left Members (24h) | Members who left in the past 24 hours |
| Mod Actions (24h) | Warnings, kicks, bans, and mutes issued |
Charts (30-Day History)
Member Growth
Line chart showing total member count over the past 30 days. Useful for spotting trends after events, giveaways, or partnership announcements.
Activity
Bar chart showing daily message and command usage side by side. Helps identify your server's most and least active days.
Member Flow
Bar chart showing daily joins vs. leaves. Use this to assess retention after recruitment drives or to spot unusual drop-off periods.
Data Retention
Analytics history covers the past 30 days and is displayed per day. The dashboard refreshes automatically every 5 minutes.